3D Scatter Plots
Package Release
This processing is now released as a blender module for ease of use, and processing improvements. Please see https://github.com/mulqueenr/blender_3D_scatter_plot for more information!
Introduction
Here’s how to generate 3D scatterplots of single cell experiments in Blender. To do this, we are going to use a similar shader to the one I use in the “molecular render” project. Additionally, I will be using blender’s python console to read in a simple text file to populate a UMAP projection.
For the text file, generate a header, tab-separated table with the following columns:
| Cluster | cellID | X | Y | Z | cluster_color_hexvalue |
|---|---|---|---|---|---|
| String, of cluster grouping | String, unique cell identifier | float of x coordinate | float of y coordinate | float of z coordinate | Hex value of fill color |
Here’s an example lines used for the render at the top of the page.
Astrocytes    TAGGTCCGACGTACTAGGGCCTCGGTCTATGGCCTA    4.24424248742567    -1.74691044949975    -6.48374510684418    #1C7D54
Astrocytes    ATTCAGAAGCATCGCGCAGCCAGACTCTATGGCCTA    3.60301401455387    -1.96493138894082    -6.47136162049336    #1C7D54
Astrocytes    TCAACGAGTTCGCGATGGTCAGAGCCCGCCGATATC    5.51775913941571    -1.87741656898663    -6.76243310557264    #1C7D54
Required software
- Blender v 2.93 or higher (link)
Description of the script and how to run
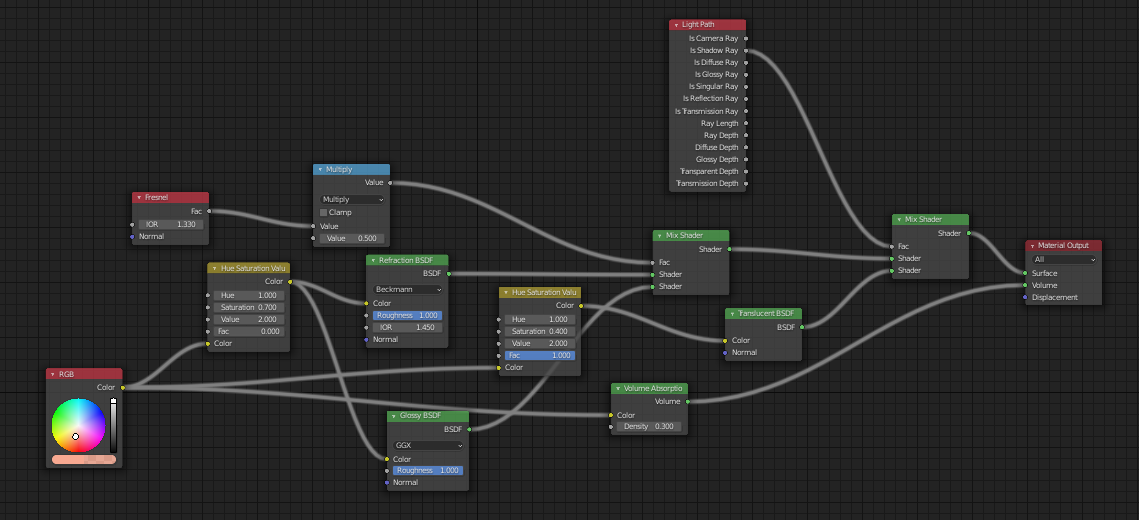
I set up a script to automate the full process. I’ll list what is happening within the script so it is a bit easier to tweak. The blender-python (bpy) API is kind of in a state right now because there is a lot of active development. Sorry it isn’t as readable as a good python script should be! To run the script, just open blender, change a window panel to “Python Console” or just press Shift+F4. Then run. The script makes a shader similar to what we use in the molecular render side project. It does this in python but the end result (when made nice to look at) is this:
This script uses linked objects (basically a way to save memory). To do this, it makes a “master” data point for each cluster, hides it, and then duplicates it for each data point. That means each data point isn’t a unique object, but a copy with a unique location. Saves on a ton of time and memory. In the future, the geometry or particle nodes might make this even easier, but this is what we have to work with now. I’ve run this script on up to 200k cells. It seems to slow down the more data-blocks there are in the blender file. From my computer, I run the plotting in 1k cell batches. I find that for each 1K cells I plot, the next 1K cells take about 0.2-0.4 more seconds. This adds up with bigger files, but hey, at least it is linear. For my trash computer, 200k cells took about 2-3 hours.
Change these lines:
#Input
file_xyz=open("C:/Users/Chad/Desktop/cortex.3D.table","r") #change the filepath to your tsv will the line format described above.
#Output
bpy.ops.wm.save_as_mainfile(filepath="C:/Users/Chad/Desktop/cortex.blend") #change filepath to the output blender file you would like
bpy.context.scene.render.filepath = 'cortex.test.png' #change file path to the output png you would like.
Here is the script as used to generate the hero image at the top of the page.
The script
Note: I updated this to incorporate better use of geometry nodes. It works much faster now. The file read in is to be corrected.
#1. import modules
import bpy
import math
import time
import bmesh
import os, sys
import addon_utils
import csv
import numpy

#use this for import https://github.com/simonbroggi/blender_spreadsheet_import/blob/main/__init__.py

def read_tsv(file_path):
    '''Read in TSV file, this is from Erindale https://www.youtube.com/watch?v=xWwoWi_vPTg&t=1737s'''
    with open(file_path,'r') as f:
        reader=csv.reader(f,delimiter="\t")
        data=list(reader)
        return(data)

def tsv_column(data,col):
    '''Parse TSV data by index as array
    This is from Erindale https://www.youtube.com/watch?v=xWwoWi_vPTg&t=1737s'''
    array=[]
    for y, row in enumerate(data):
        if y==0:
            continue
        array.append(row[col])
    return(array)

def color_splitter(array_in):
    '''Parse hex color code to split out r g and b for colors'''
    array=[]
    r_array=[]
    g_array=[]
    b_array=[]
    for i in array_in:
        hexcode=i.lstrip("#")
        rgb=[int(hexcode[i:i+2], 16) for i in (0, 2, 4)]
        r_array.append(float(rgb[0])/255) #color of spheres, blender uses 0-1 scale
        g_array.append(float(rgb[1])/255)
        b_array.append(float(rgb[2])/255)
    array=[r_array,g_array,b_array]
    return(array)

def create_object(mesh, name):
    """ https://github.com/simonbroggi/blender_spreadsheet_import/blob/main/__init__.py"""
    # Create new object
    for ob in bpy.context.selected_objects:
        ob.select_set(False)
    obj = bpy.data.objects.new(name, mesh)
    bpy.context.collection.objects.link(obj)
    bpy.context.view_layer.objects.active = obj
    obj.select_set(True)

addon_path=[mod.__file__ for mod in addon_utils.modules() if "blender_3D_scatter_plot" in mod.__file__] #get a list of all add-ons and return this one
test_data_path = addon_path[0].replace("__init__.py","test_data/test.tsv") #replace init file with test data directory and file

#Read in file and separate out columns to lists
file_in="/Users/rmulqueen/Library/Application Support/Blender/3.4/scripts/addons/blender_3D_scatter_plot-main/test_data/test.tsv"
dat=read_tsv(file_in)
n_points=len(dat)

grouping=tsv_column(data=dat,col=0)
cellid=tsv_column(data=dat,col=1)
x=[float(i) for i in tsv_column(data=dat,col=2)]
y=[float(i) for i in tsv_column(data=dat,col=3)]
z=[float(i) for i in tsv_column(data=dat,col=4)]

#Split out colors to rgb components
color_in=tsv_column(data=dat,col=5)
color_in=color_splitter(array_in=color_in)
r=color_in[0]
g=color_in[1]
b=color_in[2]
a=[0.9 for x in color_in[0]]
color_in=[]
for i in range(0,len(r)-1):
     color_in.append(float(r[i]))
     color_in.append(float(g[i]))
     color_in.append(float(b[i]))
     color_in.append(float(a[i]))

#Instance a new object and add attributes
mesh = bpy.data.meshes.new(name="csv_data")

mesh.vertices.add(n_points)
mesh.update()
object_name = bpy.path.display_name("Scatterplot")
create_object(mesh, object_name)
#Set position per vertex
for i in range(0,n_points-1):
    mesh.vertices[i].co = (x[i],y[i],z[i])

#Set color per vertex
colattr = bpy.data.meshes[mesh.name].attributes.new("color","FLOAT_COLOR","POINT")
for i in range(0,n_points-1):
    colattr.data[i].color = [r[i], g[i], b[i], 1]

obj=bpy.data.objects["Scatterplot"]
#Initiate a geometry nodes modifier
obj.modifiers.new("make_vertices","NODES")
geo_nodes=obj.modifiers["make_vertices"]
#bpy.data.node_groups.new("make_vertices","GeometryNodeTree")

#Initialize shader nodes
mymat=bpy.data.materials.new("scattermat")
mymat.use_nodes = True
shadernodes = mymat.node_tree.nodes
attr_node = shadernodes.new('ShaderNodeAttribute')
bsdf_node=shadernodes['Principled BSDF']
attr_node.location=(-300,-300) #move points node
attr_node.attribute_type = 'INSTANCER'
attr_node.attribute_name = "color"
mymat.node_tree.links.new(attr_node.outputs['Color'], bsdf_node.inputs['Base Color']) #link input counts to points


#Initialize geometry nodes
bpy.ops.node.new_geometry_node_group_assign()
bpy.data.node_groups[0].name="make_vertices"
geo_nodes.node_group = bpy.data.node_groups["make_vertices"]

#Add group input
nodetree=geo_nodes.node_group

#Add geo nodes and link
inNode=nodetree.nodes['Group Input']
outNode=nodetree.nodes['Group Output']
pointsnode=nodetree.nodes.new(type="GeometryNodeInstanceOnPoints") #add points node
icosnode=nodetree.nodes.new(type="GeometryNodeMeshIcoSphere") #add ico
icosnode.inputs['Radius'].default_value=0.05
icosnode.inputs['Subdivisions'].default_value=4

scenetimenode=nodetree.nodes.new(type="GeometryNodeInputSceneTime") #add scene time
setpositionnode=nodetree.nodes.new(type="GeometryNodeSetPosition") #add set position
setmaterialnode=nodetree.nodes.new(type="GeometryNodeSetMaterial") #add set material
setmaterialnode.inputs['Material'].default_value = bpy.data.materials["scattermat"]

voroninode=nodetree.nodes.new(type="ShaderNodeTexVoronoi") #add voroni texture
voroninode.voronoi_dimensions = '4D'
voroninode.inputs['Scale'].default_value = 1

#add subdivinsion icosphere
pointsnode.location=(-100,-300) #move points node
icosnode.location=(-300,-500)
scenetimenode.location=(-100,100)
voroninode.location=(0,400)
setpositionnode.location=(100,100)
setmaterialnode.location=(300,300)
outNode.location=(500,100)

bpy.data.node_groups["make_vertices"].nodes["Voronoi Texture"].name
nodetree.links.new(inNode.outputs['Geometry'], pointsnode.inputs['Points']) #link input counts to points
nodetree.links.new(icosnode.outputs['Mesh'], pointsnode.inputs['Instance']) #link input positions to points
nodetree.links.new(pointsnode.outputs['Instances'], setpositionnode.inputs['Geometry']) #link input positions to points
nodetree.links.new(pointsnode.outputs['Instances'], setpositionnode.inputs['Geometry']) #link input positions to points
nodetree.links.new(scenetimenode.outputs['Seconds'], voroninode.inputs['W']) #link scene time to random value to animate
nodetree.links.new(voroninode.outputs['Distance'], setpositionnode.inputs['Offset']) #link random distance to offset to move points
nodetree.links.new(setpositionnode.outputs['Geometry'], setmaterialnode.inputs['Geometry']) #link input positions to points
nodetree.links.new(setmaterialnode.outputs['Geometry'], outNode.inputs['Geometry']) #link input positions to points
Bonus
Here I took the human s3-ATAC brain data and colored by cell type. I then cranked up the emission strength and removed all external lights.