Single cell HiC
Single-cell Chromatin Conformation Capture
Motivation
Compaction of the human genome is known to play an important role in regulation of transcription. Genomes form a hierarchy of three-dimensional organization, including chromosome territories, A/B compartments associated with epigenomic markers, to smaller topologically associated domains and single chromatin loops1–3. Bulk assays for the capture of genome-wide conformation generate contact probabilities – averaging interactions over millions of cells4. However, it is now known through FISH that cells display variable genome and chromosome conformations, even when cells are genotypically and phenotypically identical5. Additionally, FISH and spectral karyotyping (SKY) remain the most common single-cell methods for uncovering genomic mutations such as translocations and inversions, which are hard to uncover with count data from whole genome sequencing or microarray. Efforts to advance single-cell chromatin conformation capture assays are being made to breach this gap6. Therefore, chromatin conformation assays have promising insight to both genomic rearrangement and genomic regulation.
Method
Two critical components for the unbiased capture of chromatin conformation within single-cells are paired-end sequencing and proximity ligation. The majority of single-cell chromatin conformation capture techniques are based on the principles of a bulk implementation of a method termed Hi-C, with adaptations for capture efficiency. In a bulk chromatin capture experiment, the chromatin of a sample is isolated and DNA is cross-linked with genome-associated proteins via a fixative such as formaldehyde7. Once covalently linked, the DNA is digested with a promiscuous restriction enzyme leaving “sticky-end” DNA 5’ or 3’ overhangs. Enzymes used are selected for a high frequency of occurrence across the genome and usually have small (and thus more likely occurring) recognition sites. These exposed base pairs are complemented with the addition of biotinylated nucleotides and the filled-in blunted ends of are ligated together via a ligase. Since DNA is fixed, it is essentially pinned to proteins and nearby DNA, therefore, the ligation of digested DNA is biased towards other strands nearby in three-dimensional space. Following ligation, DNA is fragmented, purified through a streptavidin-biotin purification, and prepared for sequencing8,9. Paired-end reads, allow for the mapping of the two ligated chimeric DNA fragments independently. From this, the two fragments are mapped to separate regions of the genome reflecting their physical proximity in three-dimensional space. Increases in the efficiency of Hi-C reactions lowered necessary genomic input, eventually to down to single-cell level. In early proof-of-concept reports of this assay, the reactions for fixation, restriction digestion and ligation were performed in situ within nuclei10. Use of the nuclear compartment led to increased signal-to-noise as compared to early Hi-C strategies4. This was then followed by a purification and second digestion to linearize DNA, prior to a blunt end adapter ligation and PCR11 (Figure 10a). sci-Hi-C was developed in order to improve on the cell count throughput of chromatin confirmation capture assays. This was done by introducing combinatorial indexing into the sample processing at gap-fill in biotinylation stage12,13 (Figure 10b). An alternative method, named Dip-C, is aimed at the capture of haplotypes within single cells14 (Figure 10c). Dip-C omits the biotin-streptavidin pull-down and adds a whole-genome amplification similar to LIANTI15. This approach captures more of the genome and more contacts per cell than sci-Hi-C, but is limited in cell count throughput. A low cell count but high coverage adaptation of Dip-C has been used to analyze contact maps in murine olfactory bulb and retinal rod receptors. In this study authors used few cells (409) with a relatively high number of chromatin contacts (median of 252,000) to separately cluster gross cell types. By leveraging additional epigenomic knowledge such as methylated regions, they uncovered that methylation frequency correlates to distance from nuclear center. This phenomenon inverts as retinal rod cells mature. Interestingly, because this data was generated on single cells, the authors were able to uncover some of the enhancer-promoter recruitment and variability in the developing population, and track the progress of euchromatic inversion. While promising for insight into gene regulation and chromatin conformation through development, this method is still in its infancy with a need to improve both cell count and contact captures per cell for greater statistical power14.
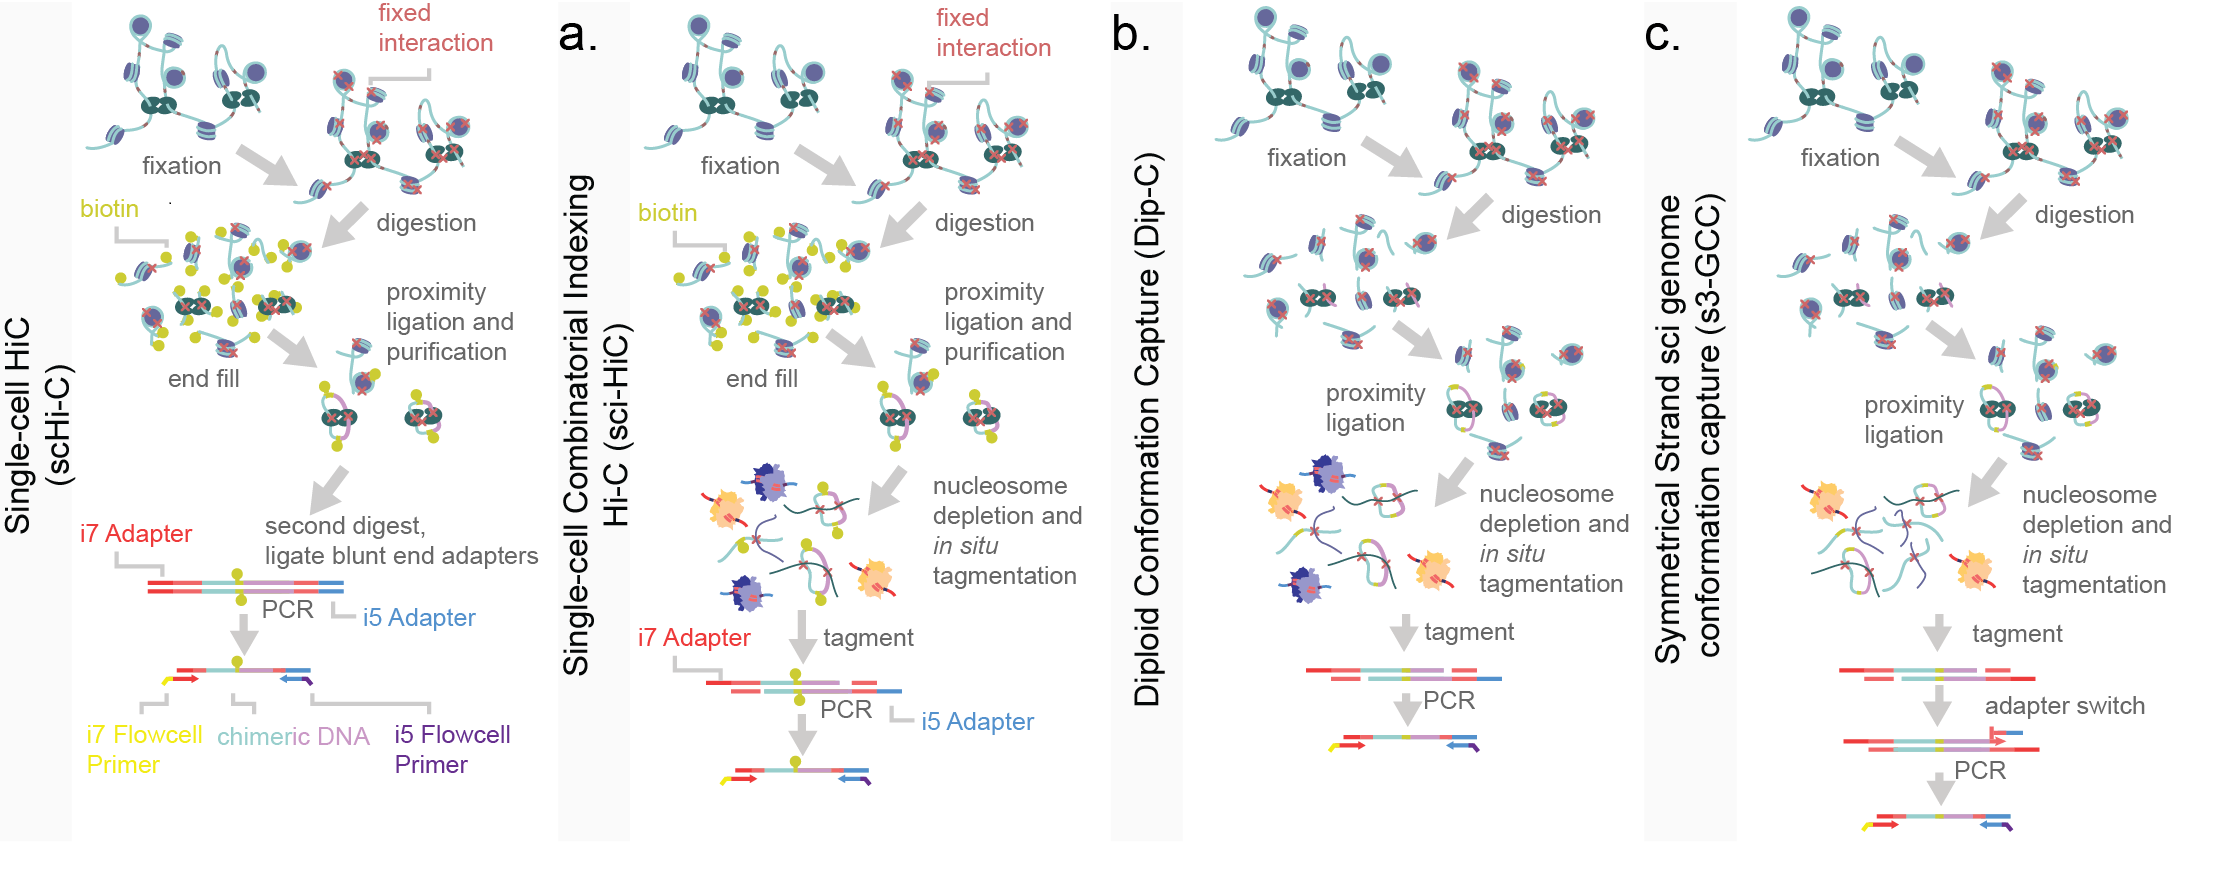
Figure 10.Schematic of single-cell chromatin conformation assays. a) Single-cell Hi-C protocol, including in situ fixation and multiple rounds of restriction digest to generate libraries. A biotin-fill in (yellow circles) is performed to allow for both proximity ligation (a low temperature blunt end ligation of nearby fragments) and the selective pull-down of biotinylated DNA during a subsequent clean-up step. Adapters are then blunt-end ligated prior to PCR. b) Single-cell combinatorial indexing Hi-C (sci-HiC) uses in situ fixation to set chromatin conformation and restriction enzyme digestion to introduce sticky ends. After biotin fill-in and purification, DNA is then tagmented and PCR amplified. c) Diploid conformation capture (Dip-C) uses a similar strategy without a biotinylation pull-down. d) Symmetrical strand sci- genome conformation capture (s3-GCC) uses a shared strategy with Dip-C wherein there is no selective pull-down for restriction digested DNA. However the more efficient s3 chemistry is used to increase information content garnered per cell (Chapter 2). Color labeling is consistent across panels.
Analysis
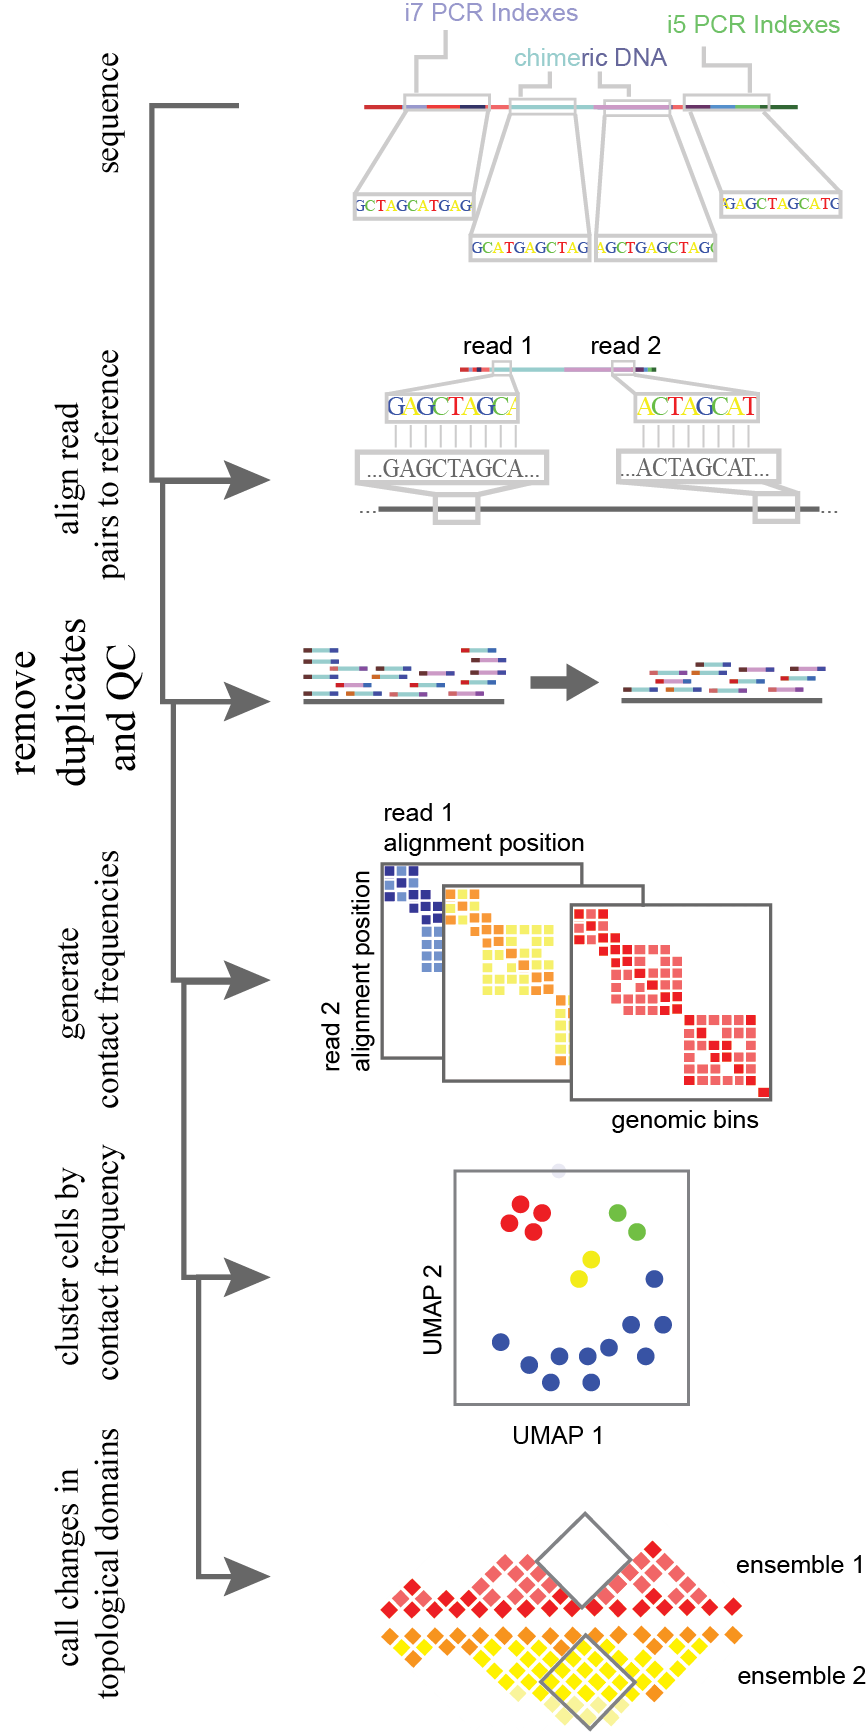
Figure 11.Analysis flow-through for single-cell HiC-like data. Chimeric library molecules are aligned to the genome with read 1 and read 2 (two reads generated through paired end sequencing) are aligned separately. Following alignment, reads are filtered for quality both in alignment confidence and the removal of any PCR duplicates. After this, a square matrix is made per cell for contact frequencies. The position of read 1 and read 2 determine the x and y axis of the matrix, and the resultant bin is the count of occurrences. Cells are then grouped together and projected into 2D space based on the normalized contact frequency matrices through a machine learning algorithm. From this grouped cells are combined for statistical power. Higher resolution ensembles are then used to determine pairwise changes in topological domains, reflecting regulatory changes or large-scale mutations.
In chromatin conformation data analysis, each end of paired-end reads are mapped independently to the reference genome and uniquely captured molecules are counted (Figure 11). The genome is binned as in single-cell whole genome processing. A square counts matrix of contact frequencies (read 1 alignment locus X read 2 alignment locus) is then generated per cell. This matrix is sparse, leading to the construction of algorithms for imputation. Two current methods built specifically for grouping single cells based on their contact frequency matrix, are scHiCluster and HiCRep/MDS16. Contact frequency bins are locally aggregated via a linear convolution or sliding window. In scHiCluster, this is then smoothed by a random walk algorithm being treated as weighted network. Alternatively, for HiCRep/MDS, the smoothed contact matrices are summarized as weighted similarity measures as in HiCRep16. The resulting matrices are clustered and projected by dimensionality reduction (with an approach such as multidimensional scaling, MDS) into two dimensional space17. Following this topological domain boundary differences between clusters can be attained through merging similar cells and analyzing the “pseudobulk” data through TopDom18. Similar to HiCRep, TopDom uses a sliding window of up and downstream bins to define genomic regions with fewer locus-locus interactions than other regions around the local genome. This faithfully recapitulates the A/B chromatin compartments seen in bulk data17. The variability in topological domains within cell populations requires further study. Early work suggests interesting mechanisms of genomic reconfiguration within 3D space that could provide insight into transcriptional recruitment machinery and the interaction of different epigenomic markers in physical space14. To improve on this method, and to provide a means of improved CNA detection, I developed a method of single-cell genome conformation capture using the s3 chemistry described previously in this thesis (s3-GCC, Figure 10c).
References
- Cremer, T. & Cremer, C. Chromosome territories, nuclear architecture and gene regulation in mammalian cells. Nature Reviews Genetics 2, 292–301 (2001).
- Bickmore, W. A. The spatial organization of the human genome. Annual Review of Genomics and Human Genetics 14, 67–84 (2013).
- Dekker, J. & Mirny, L. The 3D Genome as Moderator of Chromosomal Communication. Cell 164, 1110–1121 (2016).
- Rao, S. S. P. S. P. et al. A 3D Map of the Human Genome at Kilobase Resolution Reveals Principles of Chromatin Looping. Cell 159, 1665–1680 (2014).
- Osborne, C. S. et al. Active genes dynamically colocalize to shared sites of ongoing transcription. Nat. Genet. 36, 1065–1071 (2004).
- Tan, L., Xing, D., Chang, C. H., Li, H. & Xie, X. S. Three-dimensional genome structures of single diploid human cells. Science (80-. ). 361, 924–928 (2018).
- Hoffman, E. A., Frey, B. L., Smith, L. M. & Auble, D. T. Formaldehyde crosslinking: A tool for the study of chromatin complexes. Journal of Biological Chemistry 290, 26404–26411 (2015).
- Rao, S. S. P. et al. A 3D map of the human genome at kilobase resolution reveals principles of chromatin looping. Cell 159, 1665–1680 (2014).
- Lieberman-Aiden, E. et al. Comprehensive mapping of long-range interactions reveals folding principles of the human genome. Science (80-. ). 326, 289–293 (2009).
- Nagano, T. et al. Single-cell Hi-C reveals cell-to-cell variability in chromosome structure. Nature 502, 59–64 (2013).
- Nagano, T. et al. Single-cell Hi-C reveals cell-to-cell variability in chromosome structure. Nature 502, 59–64 (2013).
- Ramani, V. et al. Sci-Hi-C: A single-cell Hi-C method for mapping 3D genome organization in large number of single cells. Methods 170, 61–68 (2020).
- Ramani, V., Qiu, R. & Shendure, J. High-throughput determination of RNA structure by proximity ligation. Nat. Biotechnol. 33, 980–984 (2015).
- Tan, L., Xing, D., Chang, C. H., Li, H. & Xie, X. S. Three-dimensional genome structures of single diploid human cells. Science (80-. ). 361, 924–928 (2018).
- Chen, C. et al. Single-cell whole-genome analyses by Linear Amplification via Transposon Insertion (LIANTI). Science (80-. ). 356, 189–194 (2017).
- Liu, J., Lin, D., Yardımcı, G. G. & Noble, W. S. Unsupervised embedding of single-cell Hi-C data. Bioinformatics 34, i96–i104 (2018).
- Zhou, J. et al. Robust single-cell Hi-C clustering by convolution- And random-walk–based imputation. Proc. Natl. Acad. Sci. U. S. A. 116, 14011–14018 (2019).
- Shin, H. et al. TopDom: An efficient and deterministic method for identifying topological domains in genomes. Nucleic Acids Res. 44, e70 (2015).