Single cell ATAC
Single-Cell Chromatin Accessibility Assays
Motivation
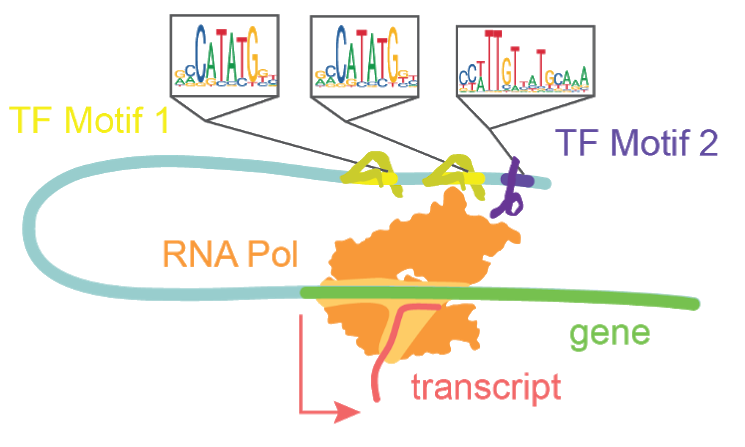
Transcription factors bind motifs and work in concert to drive transcription.
The diploid human genome contains roughly 6.4 billion base pairs, totaling a distance of over 3.84 meters of linearized DNA per nucleus. To maintain nuclear integrity and limit search space for DNA binding proteins, cells compact their genomes such that only 1-4% of it is accessible at a given time1. This is achieved by the coiling of DNA around histone proteins and condensation of those resultant nucleosomes into larger macromolecular structures. The regions which remain accessible are highly enriched in genomic content relevant to regulating transcription and defining cell type and state, including gene promoters and enhancers2. A single-cell approach to measuring chromatin accessibility shares the same two previously stated benefits of single-cell analysis over bulk approaches. Namely, i) single-cell approaches allow for the unbiased interrogation of multiple cell types within a complex tissue sample, and ii) single-cell approaches provide a higher resolution of chromatin reconfiguration in actively differentiating systems than in bulk assays. Most variants uncovered in GWAS studies of neurodevelopmental disorders are located in non-coding regions, thus demonstrating the significance of assessing non-coding regulatory elements3. Using a single-cell chromatin accessibility assay, we are able to uncover which cell types express these non-coding regions that are associated with disease states4. By tracking accessible sites in single-cells one can infer the activity of transcription factors, track the opening of enhancers, and infer their recruitment to promoter regions.
Method
In order to catalog the small sections of the genome that are accessible in each cell, several strategies have been developed. All strategies share the common through-line of leveraging the susceptibility of exposed DNA to insult when compared to compacted DNA. All assays are based on the premise of fragmenting the more vulnerable DNA and the subsequent capture of fragments for sequencing library preparation. DNase-based methods were until recently the most prominent method, being used in the Encyclopedia of DNA Elements (ENCODE) project. In this approach, the genome, while in its native state, is treated with DNase I, a protein that can digest both single and double stranded DNA (Figure 4). Enzymes are limited by their protein footprint so condensed heterochromatic regions are sterically protected from enzymatic action. The fragmented DNA can then be captured, and sequencing adapters appended for massively parallel sequencing (Figure 4a)1. While DNase approaches have been adapted to a single-cell format, this method remains difficult to titer. Changes in DNase I concentration or incubation greatly affect library quality5. An alternative method is THS-seq, wherein hyperactive transposase (the protein Tn5) is loaded with a bacterial T7 promoter region and tagmented into regions accessible to the Tn5, again using steric hindrance to select for open regions (Figure 4b). Tagmented DNA is isolated and in vitro transcription is used to amplify regions via the added T7 promoter region. RNA intermediates reflecting the open regions of chromatin are then reverse transcribed and sequencing adapter are added6.
Assay for Transposase Accessible Chromatin (ATAC).
By far the most widely used assay for accessible chromatin is ATAC-seq (Assay for Transposase Accessible Chromatin using sequencing)7. This method uses the same Tn5 protein used in THS-seq, but uses a simplified workflow. The Tn5 enzyme is, as previously mentioned, sterically limited to regions of open chromatin. ATAC-seq involves loading the enzyme with adapters necessary for PCR and sequencing. At open regions, the Tn5 enzyme both fragments the genomic DNA and appends the PCR adapters in the same reaction (Figure 4c). The excised accessible DNA can then be amplified selectively by using complementary primers. This assay is far more efficient at the capture of open genomic regions than the other approaches and has been adapted to optimize cell isolation and tagmentation conditions8. Recently commercialized versions of single-cell ATAC was made available which encapsulates cells or nuclei within microfluidic droplets9,10. Another means of single-cell ATAC popularized by us and others is sci-ATAC which uses the aforementioned split-pool barcoding approach (combinatorial indexing) (Figure 4d)4,11.
Figure 4. Single-cell chromatin accessibility assays. a) Single-cell DNase-seq uses DNAse I (purple) digests open chromatin, adapters are subsequently added. b) Single-cell transposome hypersensitive site sequencing (scTHS-seq) uses a transposase (green) to introduce a T7 bacterial promoter region to open chromatin and amplify DNA through an RNA intermediate via in vitro transcription (orange). c) Single-cell assay for transposase accessible chromatin (scATAC) uses two species of transposase to introduce i5 and i7 adapter sequences. Cells are then encapsulated in droplets with an oligonucleotide coated gel bead to uniquely index each cell. d) Single-cell combinatorial indexing assay for transposase accessible chromatin (sci-ATAC) uses two species of transposase (purple and orange) to introduce two adapters directly into open chromatin. e) Symmetrical strand sci-ATAC uses a single species of transposase and subsequent adapter switching strategy to amplify open regions, further detailed in Chapter 2. Labeled DNA oligonucleotide colors are consistently colored across panels.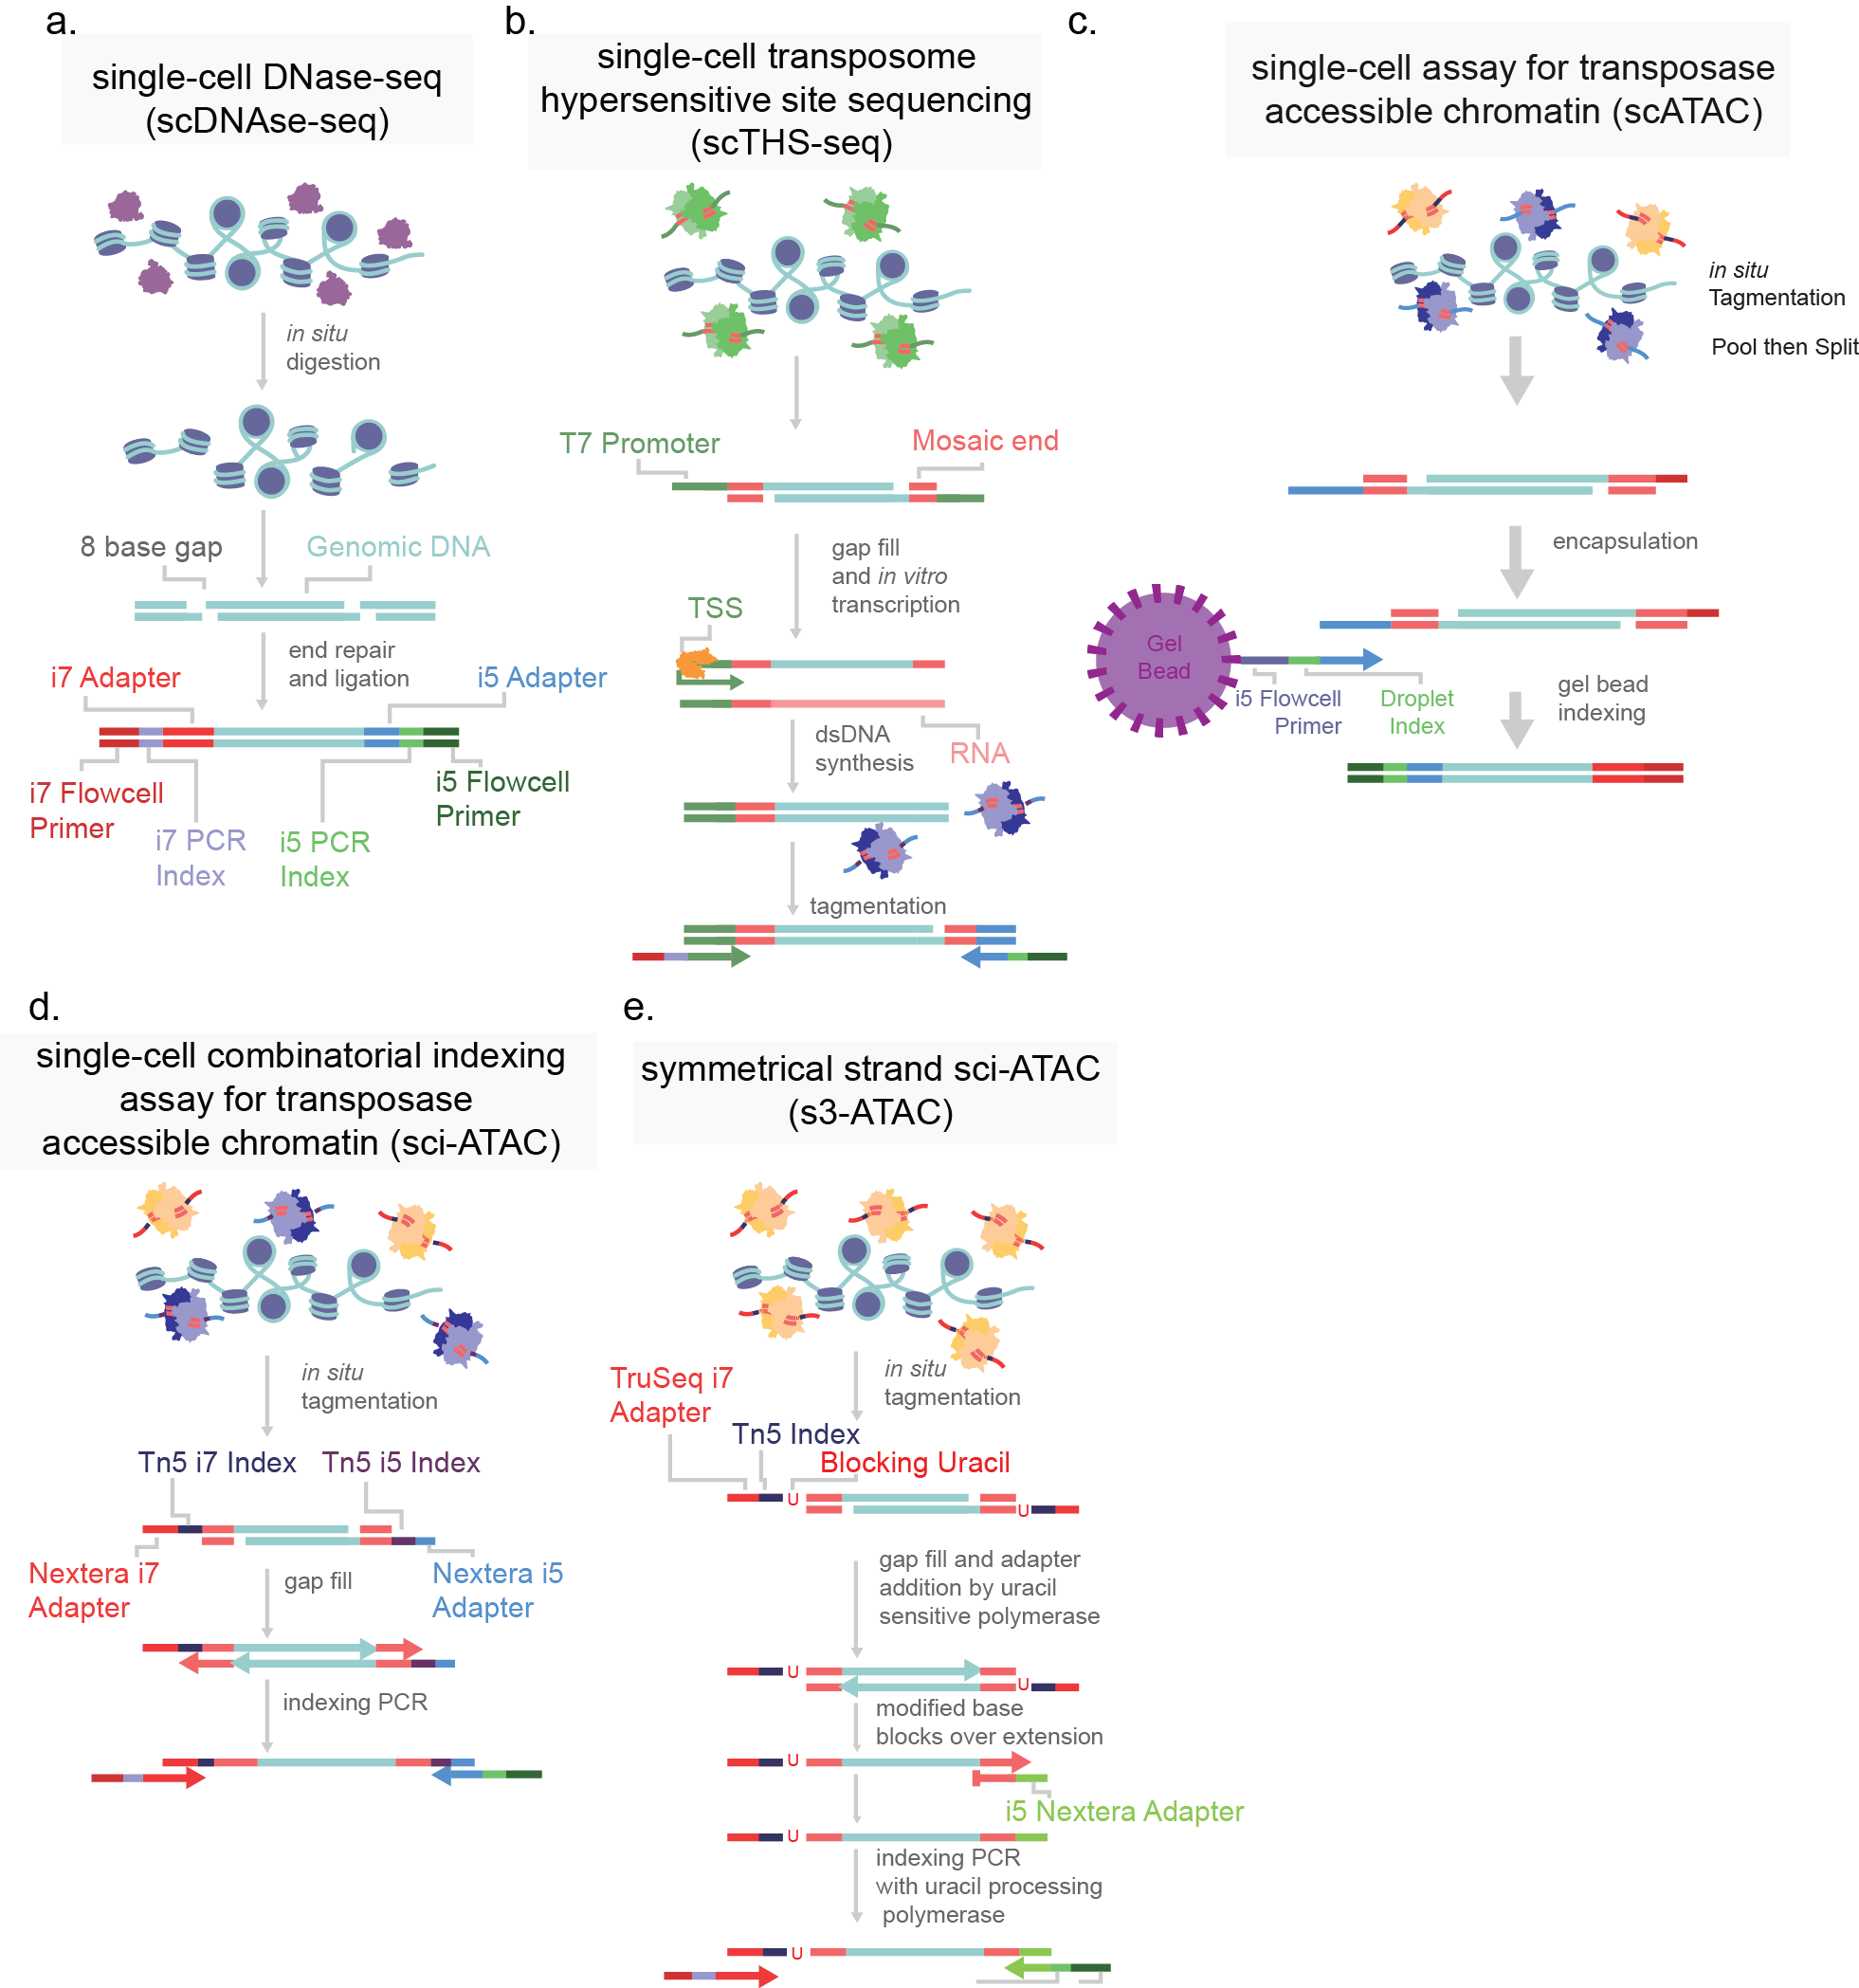
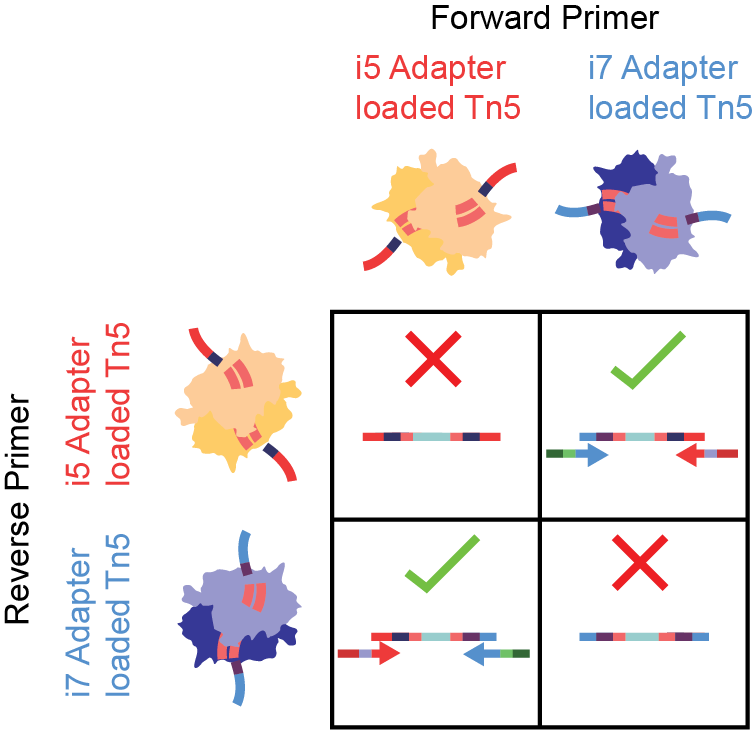
Figure 5.Tagmentation with two separate adapter-loaded Tn5 species has loss in effiency. In a captured molecule, i5 and i7 adapters must be added in the proper orientation for PCR. i5-i5 (top left) and i7-i7 tagmentations (bottom right) are not sequencable, despite the genomic regions being open.
Analysis
Single-cell chromatin accessibility data is count data. Single-cell ATAC-seq methods are by far the most widely used and their analysis will be detailed below; however, similar analysis can be performed with any of the above listed alternative protocols. Genomic DNA fragments captured in the assay are sequenced and aligned to a reference genome by an alignment algorithm (Figure 6)12,13. Reads which overlap in alignment (“pile-ups”) are used to define discretized regions of open chromatin, essentially assuming that the chromatin accessibility protocol is biasing sequence capture to unprotected regions. The calling of discrete open chromatin regions, or peaks, is done with an peak-calling algorithm, like MACS214, which uses a Poisson distribution of reads across the mappable genome in a sliding window of bins. If there are more read counts in a region than expected by this null hypothesis, a peak region is called and an open region of the genome is uncovered14. These peaks are then used to “bin” the genome into sites with evidence of accessibility. Single-cell ATAC-seq methods apply peak-calling on the full data set, not accounting for single cells, since any given diploid cell can have at most four captured reads at a given base (two copies of each top and bottom DNA strands). Once peaks are called on the entire data set, cell identity is mapped back to individual reads via the cell identifier (the unique combination of indexes) to generate a sparse cell x peak matrix4,11, populated by the number of reads per cell aligning to an open region.
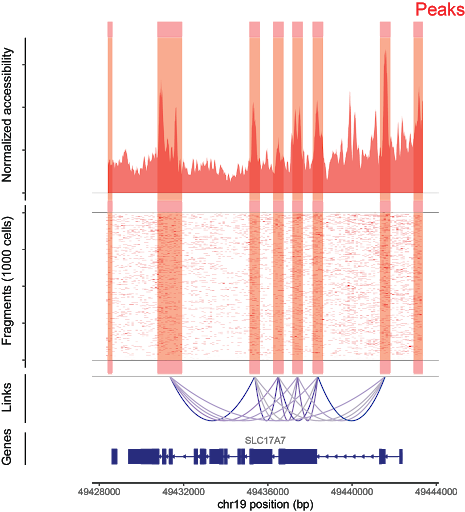
Fragments per cell are aligned to the genome (center). Aggregate fragments across cells are used to generate signal for peak calling (top). From this, peaks that share accessibility correlations are used to generate cis-coaccessibility networks (bottom).
Cells are then grouped together based on similarity of peak coverage to overcome single-cell data sparsity. Natural language processing approaches like latent semantic indexing (LSI) apply a weighting schema where peaks more commonly used are decreased in importance15. Alternatively, machine-learning approaches such as the latent Dirichlet algorithm (LDA) is used to generate “topics” or groups of peaks commonly seen together within the data. From there the cell x peak matrix is reduced from hundreds of thousands of peaks to a couple of dozen topics, where the number of topics scales with the complexity of the data set. This addresses both the data sparsity of single cells and captures biological information within peaks, wherein shared open sites tend to be enriched in common transcription factor motifs or linked to biological ontology16. Following dimensionality reduction, cells are grouped together based on their shared topic weighting by Louvain based clustering algorithms17. Cells are projected into two dimensional space via a machine learning algorithm like uniform manifold approximation and mapping (UMAP) or t-distributed stochastic neighbor embedding (tSNE)18.
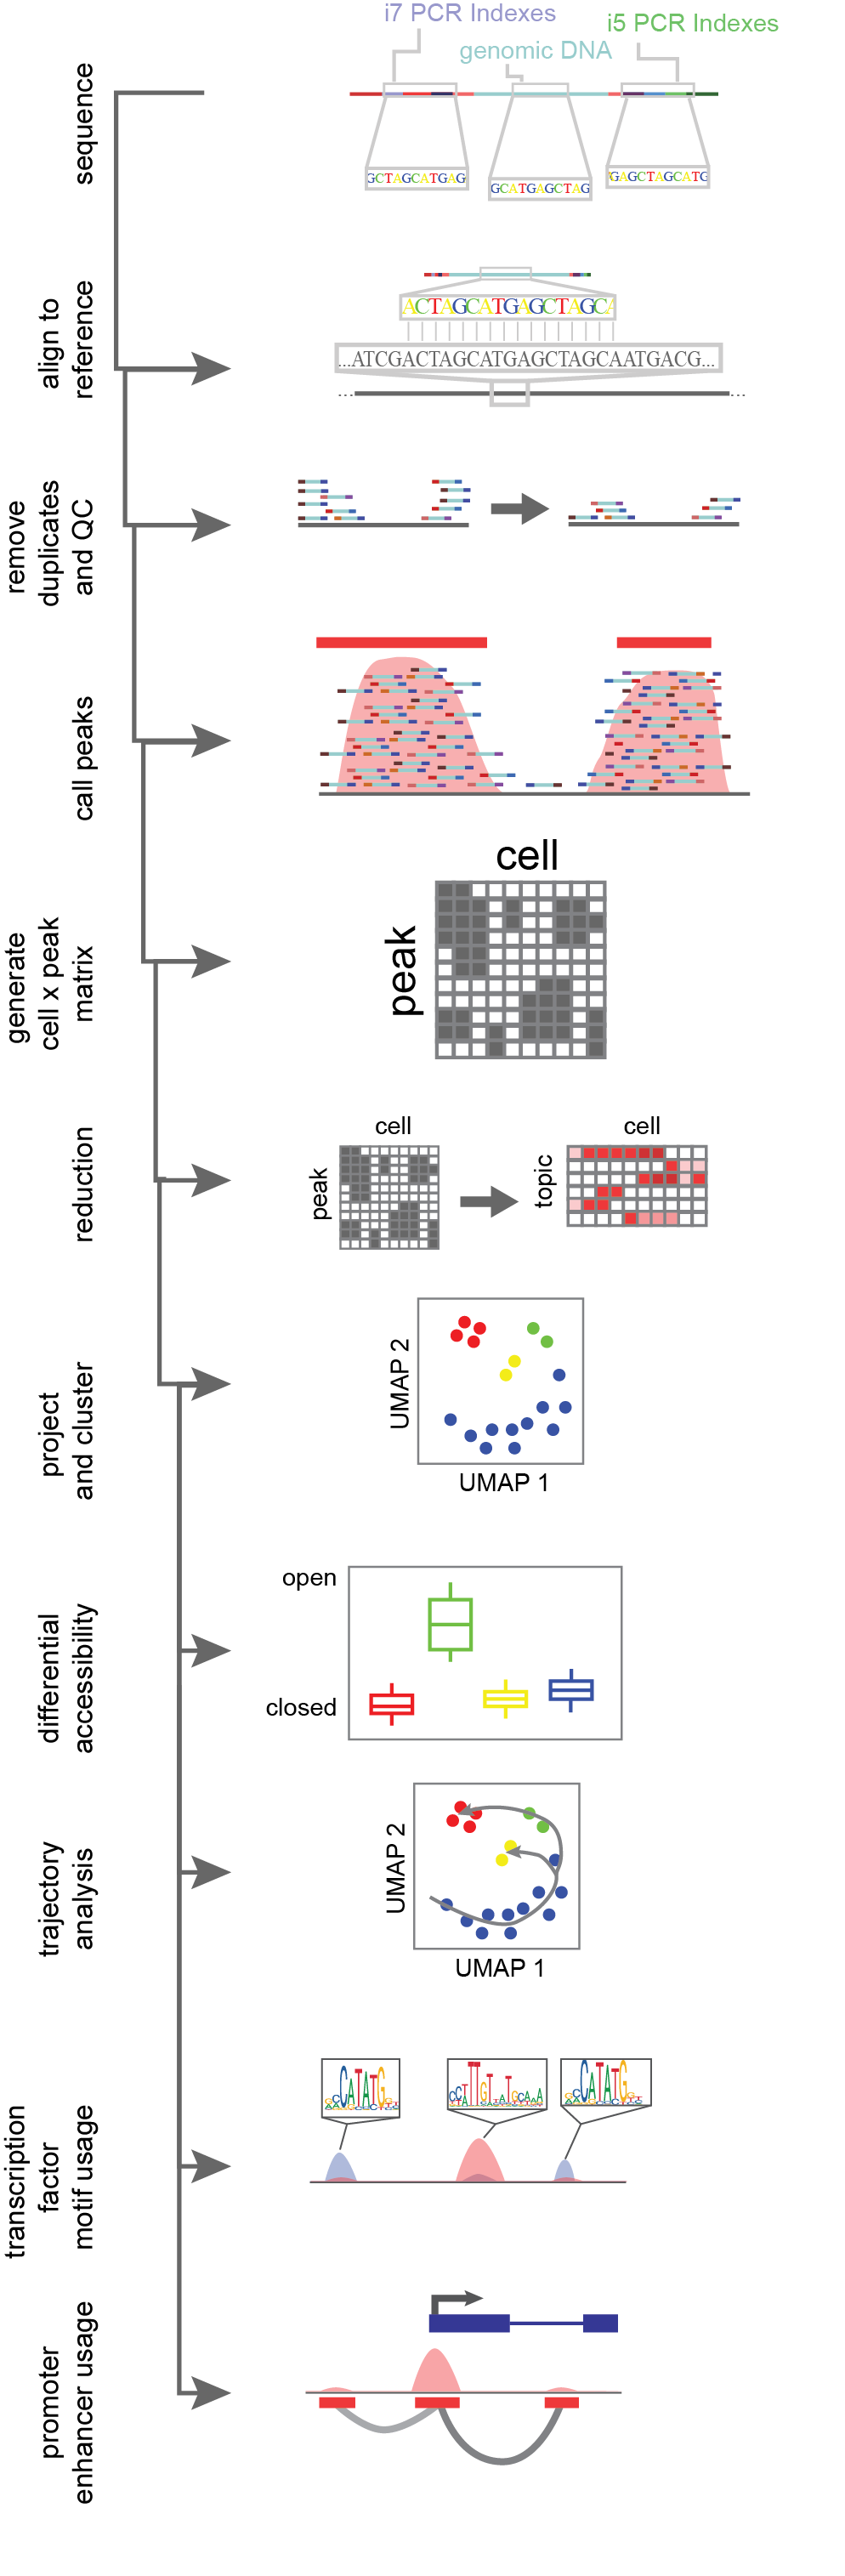
Figure 6.Flow-through of single-cell ATAC-seq data analysis. Reads are generated through sequencing, aligned to a reference, de-duplicated and filtered based on quality control metrics, read pile-ups along the genome are called, then a counts matrix of cell identifier by read count per peak is generated. This counts matrix is then reduced in dimensionality, and clustered and projected into 2D space. From there cluster aggregates (all cells combined within a cluster) have the power for differential accessibility analysis, and can be used for trajectory analysis, transcription factor motif usage and the assessment of cis-coaccessible networks for promoter-enhancer interactions.
Following the unbiased clustering of cells, differences in peak usages between clusters are assessed by use of logistic regression tests. Additionally, the activity of transcription factors can be inferred per cell, based on the expression of transcription factor specific DNA binding motifs. If each peak with reads for a cell is binarized, transcription factor activity can be inferred based on the overrepresentation of motifs present in open sites19,20. Given that enhancers and promoters are recruited in a concerted effort to drive transcription, this implies that the accessibility of both promoters and enhancers should co-occur if a site is acting in an enhancer-like function. To assess this agnostically within a data set, we look for the co-occurrence of accessibility in local enhancers linked to a peak region overlapping a known promoter. Cis-co-accessible networks (CCANs) are anchored at the promoter peak, and generated through correlation to other accessible nearby peaks for each cells with proper coverage. This network of enhancers and gene promoters better correlate with gene transcription as compared to either promoter accessibility alone or average gene body accessibility21,22. This is possible through the statistical power generated by so many independent samples made in single-cell library preparation. In order to leverage single-cell data to assess cell differentiation or epigenomic shifts, we can order cells in reduced dimensionality space and calculate a minimal spanning tree, or L1-graph, which traverses across cells, minimizing the residual distance from the tree. This allows for ordering of cells in order to infer programmatic shifts in the epigenome during cell state shifts23.
In recent works, whole organism atlases have been generated on human and mouse development4,24. While not focused directly on corticogenesis, these data sets reveal the waves of transcription factor motif accessibility changes as stem cells progress towards maturing neurons. As excitatory neurons mature in the human cortex, there is a marked opening of Rfx and Tal-related transcription factor binding sites (e.g. RFX2, TWIST2, NEUROD1) and a closing of early radial glial marker sites like SOX2 and POU factors (e.g. POU2F1), reflecting a concordance with known transcriptomic changes4. Further, chromatin accessibility across cortical neurons reflects the spatial organization of cortical layering in the murine brain24. However, many questions of chromatin dynamics, RG division, fate specification, and regulatory network formation persist that require a focused approach.
References
- Dunham, I. et al. An integrated encyclopedia of DNA elements in the human genome. Nature 489, 57–74 (2012).
- Buenrostro, J. D. et al. Single-cell chromatin accessibility reveals principles of regulatory variation. Nature 523, 486–490 (2015).
- Buniello, A. et al. The NHGRI-EBI GWAS Catalog of published genome-wide association studies, targeted arrays and summary statistics 2019. Nucleic Acids Res. 47, D1005–D1012 (2019).
- Domcke, S. et al. A human cell atlas of fetal chromatin accessibility. Science 370, (2020).
- Cooper, J., Ding, Y., Song, J. & Zhao, K. Genome-wide mapping of DNase I hypersensitive sites in rare cell populations using single-cell DNase sequencing. Nat. Protoc. 12, 2342–2354 (2017).
- Sos, B. et al. Characterization of chromatin accessibility with a transposome hypersensitive sites sequencing (THS-seq) assay. Genome Biol 17, 20 (2016).
- Buenrostro, J. D., Wu, B., Chang, H. Y. & Greenleaf, W. J. ATAC-seq: A Method for Assaying Chromatin Accessibility Genome-Wide. Curr. Protoc. Mol. Biol. 21.29.1-21.29.9 (2015). doi:10.1002/0471142727.mb2129s109
- Adey, A. et al. Rapid, low-input, low-bias construction of shotgun fragment libraries by high-density in vitro transposition. Genome Biol. 11, R119 (2010).
- Satpathy, A. T. et al. Massively parallel single-cell chromatin landscapes of human immune cell development and intratumoral T cell exhaustion. Nat. Biotechnol. 37, 925–936 (2019).
- Lareau, C. A. et al. Droplet-based combinatorial indexing for massive-scale single-cell chromatin accessibility. Nat. Biotechnol. (2019). doi:10.1038/s41587-019-0147-6
- Sinnamon, J. R. et al. The accessible chromatin landscape of the hippocampus at single-cell resolution. doi:10.1101/407668
- Li, H. & Durbin, R. Fast and accurate short read alignment with Burrows-Wheeler transform. Bioinformatics 25, 1754–1760 (2009).
- Langmead, B. & Salzberg, S. L. Fast gapped-read alignment with Bowtie 2. Nat. Methods 9, 357–9 (2012).
- Zhang, Y. et al. Model-based Analysis of ChIP-Seq (MACS). Genome Biol. 9, R137 (2008).
- Cusanovich, D. A. et al. Multiplex single-cell profiling of chromatin accessibility by combinatorial cellular indexing. Science (80-. ). 348, 910–914 (2015).
- González-Blas, C. B. et al. Cis-topic modelling of single cell epigenomes. bioRxiv 370346 (2018). doi:10.1101/370346
- Stuart, T., Srivastava, A., Lareau, C. & Satija, R. Multimodal single-cell chromatin analysis with Signac. bioRxiv 2020.11.09.373613 (2020). doi:10.1101/2020.11.09.373613
- Becht, E. et al. Dimensionality reduction for visualizing single-cell data using UMAP. Nat. Biotechnol. 37, 38–44 (2018).
- Khan, A. et al. JASPAR 2018: update of the open-access database of transcription factor binding profiles and its web framework. Nucleic Acids Res. 46, D260–D266 (2018).
- Schep, A. N., Wu, B., Buenrostro, J. D. & Greenleaf, W. J. chromVAR: inferring transcription-factor-associated accessibility from single-cell epigenomic data. Nat. Methods 14, 975–978 (2017).
- Pliner, H. A. et al. Cicero Predicts cis-Regulatory DNA Interactions from Single-Cell Chromatin Accessibility Data. Mol. Cell 71, 858-871.e8 (2018).
- Stuart, T. et al. Comprehensive Integration of Single-Cell Data. Cell 177, 1888-1902.e21 (2019).
- Qiu, X. et al. Reversed graph embedding resolves complex single-cell trajectories. Nat. Methods 14, 979–982 (2017).
- Cusanovich, D. A. et al. A Single-Cell Atlas of In Vivo Mammalian Chromatin Accessibility. Cell 174, 1309-1324.e18 (2018).