Why single-cell analysis?
Bulk methods to capture chromatin accessibility1, chromatin conformation2, DNA methylation3 and others have increased our understanding of cell state diversity and the interplay between these features4,5. In actively developing samples, or on samples of complex tissue, bulk assays fall short. By capturing and processing thousands to millions of cells together, signals are merged to an average, covering up cellular diversity and genomic decision points. To specify the region, cell type, or developmental stages linking neurotypical cortical development with disorders, efforts have been made to take sequential samples for a time-course analysis, or to perform micro-dissections of the cortex6,7. These two approaches, while able to garner critical information, still lack the granularity to catalog a causative string of events for cell fate decisions, leaving the development of new single-cell methods as a promising recourse.
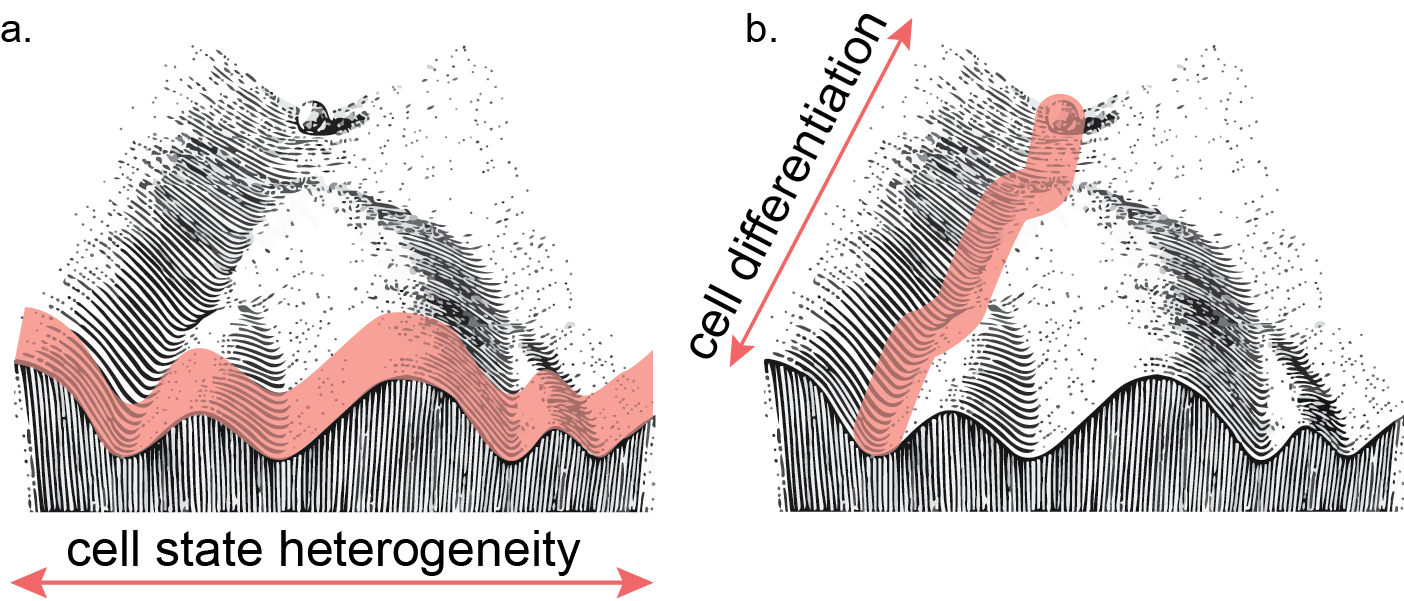
Figure 1. Abstracted landscape of cellular heterogeneity (a.) and differentiation (b.) through Waddington’s model.
Single-cell applications, the assessment of genomic or epigenomic profiles from discrete single cells, exists to address the shortcomings of those previous experimental designs. Sampling one cell at a time has two major benefits. The first is a less biased count of heterogeneity in a sample. For instance, previous post-mortem analysis demonstrated a large variance of cell type proportions across individual cortical samples. This heterogeneity has been known to skew analysis in bulk samples8. A second approach would be to isolate cells through a marker. However this approach can introduce bias into systems, especially when studying cell state transitions9. Through capturing cells in an unbiased manner and supsetting data to cells of interest post hoc, this effect can be mitigated and assumptions before data acquisition are limited — isolation of a single cell type allows for a more powerful case-control comparison. For instance, single-cell RNA libraries generated from 48 individuals with Alzheimer’s disease pathology uncovered many more differences using pairwise comparisons respective of cell types than have been previously uncovered in bulk data sets, which compare across all cell types at once. This was driven by the direct comparison between relatively sparse glial suptypes, which are masked in bulk libraries10. This same method has been applied to other disorders including major depression11, autism spectrum12, and multiple sclerosis13. Secondly, single-cell analysis is used for a higher resolution view at dynamic processes. Time course experiments done in bulk are limited by sampling rate, and generally share the same problem with averaging across many cells, or having to synchronize cell cycle or conditional responses prior to sampling. By using a single-cell approach one can capture and order cells through their progression of a state change14. Single-cell analysis allows for a higher resolution view into dynamic processes, and the regulatory landscape across complex tissue (Figure 1).
Single-cell methods have been developed for many epigenomic and genomic assays, however the analyses share a common through-line. Cells are independently, and specifically labelled with a DNA oligonucleotide index that is shared in every sequence read out generated from that cell, such that each read can be assigned back to a specific reaction condition. Single-cell assays work through isolation; tissue or cell cultures are dissociated and single-cells are placed into a reaction vessel. In its simplest form, the reaction vessel is a single tube (Figure 2a). While this strategy tends to perform well on information captured per cell, a “one cell, one well” strategy is limiting in terms of both cost and effort, and these experimental designs tends to suffer from low cell counts. To address this, commercialized products have been developed to increase throughput. Nanowell platforms increase the throughput of the “one cell, one well” strategy by shrinking the well and using specialized means of dispersing the dissociated cell suspension and decreasing reagent cost per cell by limiting volume15 (Figure 2b). Alternatively, microfluidic droplet devices use water-oil emulsions as a means to isolate cells into their own partitioned reaction vessels16–18 (Figure 2c). In these commercialized reactions, each reaction vessel also contains a microbead coated with a single index identifier that is unique, thus labelling the one cell present within the microfluidic droplet uniquely. A limitation that persists is each assay is that they are still bottlenecked by the one cell, one well strategy. This limits throughput and puts a burden of effort and cost on the experimenter. An alternative to these strategies, popularized by us and others, is the use of a split-pool indexing strategy called combinatorial indexing (Figure 2d). Cells can be uniquely labelled without ever being physically isolated. Instead of a single round of uniquely labelling cells, we perform multiple rounds of labelling, with random sampling in between. In this approach, the combination of indexes becomes the unique identifier for each cell. This process is empirically tailored to account for the random chance that multiple cells may follow the same path through library preparation. This is done by limiting the number of cells in the second round of indexing such that the likelihood of any two cell occupying the same well in the first and second round of indexing is sufficiently low19. This allows for multi-cell reactions without physical isolation of single cells. This strategy addresses both low cell count, and low assay efficiency concerns at once, driving down experimental cost and effort.
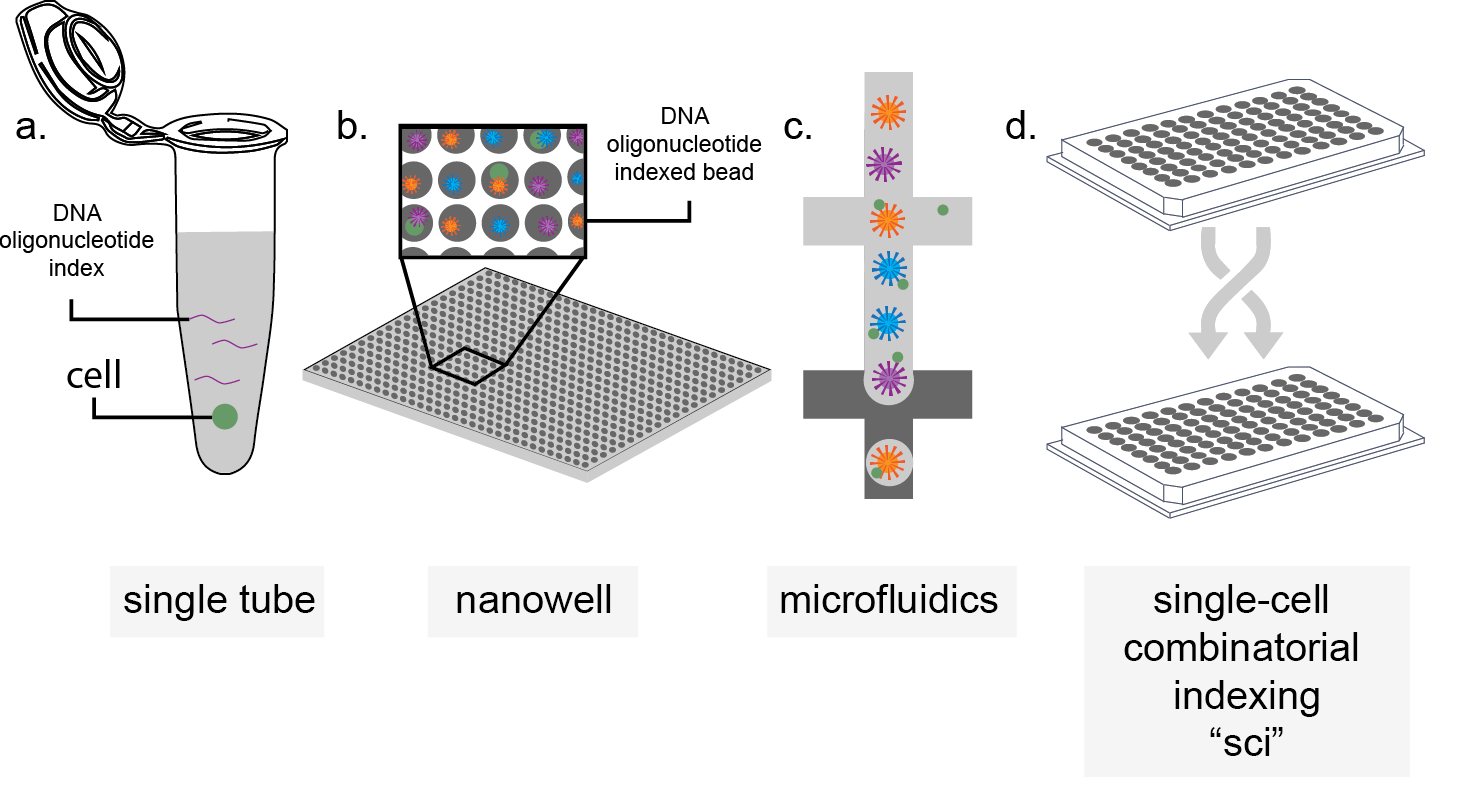
Figure 2. Schematized methods of single-cell isolation. a.) Single-cell single tube isolation, b.) nanowell isolation, c.) microfluidic droplet separation, d.) split-pool labelling (e.g. sci- chemistry). Cells (green) are isolated by various means and co-occupy a space with either DNA oligonucleotide indexes (purple line), oligonucleotide-coated beads (blue, purple, and orange stippled circles), or undergo combinatorial indexing.
Regardless of epigenomic or transcriptomic assay, each single cell captured tends to have low information content, with a non-trivial amount of drop-out20 due to inefficiency in information capture and inherently low input per reaction. To overcome information drop-out, cells are grouped together based on similarities across the measured moiety. Cells are then aggregated together making multiple “pseudo-bulk” libraries of pure cell types or states — agnostically grouping cells for unbiased analyses. The process of single-cell aggregation also highlights a key concern about experimental design: they must balance information per cell with number of cells sampled. Low information content per single cell requires assumptions to be made about cell grouping, as there is high noise in low-information content system. By having low cell count, there is a risk of losing rare cell types, or having insufficient power for pairwise analyses. This key concern informs the strategy of single-cell capture and the assay used. In the case of cortical development, multiple cellular suptypes are differentiating in parallel, leading to a need for both breadth of cell count and high information per cell to make the most of captured rare events.
References
- Buenrostro, J. D., Wu, B., Chang, H. Y. & Greenleaf, W. J. ATAC-seq: A Method for Assaying Chromatin Accessibility Genome-Wide. Curr. Protoc. Mol. Biol. 21.29.1-21.29.9 (2015). doi:10.1002/0471142727.mb2129s109
- Lieberman-Aiden, E. et al. Comprehensive mapping of long-range interactions reveals folding principles of the human genome. Science (80-. ). 326, 289–293 (2009).
- Frommer, M. et al. A genomic sequencing protocol that yields a positive display of 5- methylcytosine residues in individual DNA strands. Proc. Natl. Acad. Sci. U. S. A. 89, 1827–1831 (1992).
- Luo, C. et al. Single-cell methylomes identify neuronal subtypes and regulatory elements in mammalian cortex. Science (80-. ). 357, 600–604 (2017).
- Pliner, H. A. et al. Cicero Predicts cis-Regulatory DNA Interactions from Single-Cell Chromatin Accessibility Data. Mol. Cell 71, 858-871.e8 (2018).
- Raphael, B. J. et al. Integrated Genomic Characterization of Pancreatic Ductal Adenocarcinoma. Cancer Cell (2017). doi:10.1016/j.ccell.2017.07.007
- Tasic, B. et al. Shared and distinct transcriptomic cell types across neocortical areas. Nature 563, 72–78 (2018).
- McGregor, K. et al. An evaluation of methods correcting for cell-type heterogeneity in DNA methylation studies. Genome Biol. 17, 84 (2016).
- Song, M. et al. Cell-type-specific 3D epigenomes in the developing human cortex. Nature 587, 644–649 (2020).
- Mathys, H. et al. Single-cell transcriptomic analysis of Alzheimer’s disease. Nature 570, 332–337 (2019).
- Nagy, C. et al. Single-nucleus transcriptomics of the prefrontal cortex in major depressive disorder implicates oligodendrocyte precursor cells and excitatory neurons. Nat. Neurosci. 23, 771–781 (2020).
- Velmeshev, D. et al. Single-cell genomics identifies cell type–specific molecular changes in autism. Science (80-. ). 364, 685–689 (2019).
- Schirmer, L. et al. Neuronal vulnerability and multilineage diversity in multiple sclerosis. Nature 573, 75–82 (2019).
- Qiu, X. et al. Reversed graph embedding resolves complex single-cell trajectories. Nat. Methods 14, 979–982 (2017).
- Mezger, A. et al. High-throughput chromatin accessibility profiling at single-cell resolution. Nat. Commun. 9, 1–6 (2018).
- Lareau, C. A. et al. Droplet-based combinatorial indexing for massive-scale single-cell chromatin accessibility. Nat. Biotechnol. 37, 916–924 (2019).
- Lareau, C. A. et al. Droplet-based combinatorial indexing for massive-scale single-cell chromatin accessibility. Nat. Biotechnol. (2019). doi:10.1038/s41587-019-0147-6
- Satpathy, A. T. et al. Massively parallel single-cell chromatin landscapes of human immune cell development and intratumoral T cell exhaustion. Nat. Biotechnol. 37, 925–936 (2019).
- Sinnamon, J. R. et al. The accessible chromatin landscape of the hippocampus at single-cell resolution. doi:10.1101/407668
- Sos, B. et al. Characterization of chromatin accessibility with a transposome hypersensitive sites sequencing (THS-seq) assay. Genome Biol 17, 20 (2016).